Configurations
Horizontal, Cathode facing down |
|
|
|
|
Co-current flows
| Carbon Cloth 1 |
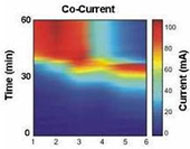
Spatio-temporal data showing startup with low flows, (FO2, FH2) = (3,6), an increase to (6,12) and a decrease to (3,6.2). Irregular fluctuations start after the decrease. |
| |
Video 1: Frames taken at 1 per minute showing water collecting at the back of the flow channel, periodically forming a slug, and being pushed out of the channel. The start time corresponds to time 546 s in the data file. Inlets are to the right. |
| |
File name: MEA15-25-constco-flooding-cathodedown1.xls |
| Carbon Cloth 2 |
Spatio-temporal data showing startup with low flows, (FO2, FH2) = (3,6), and changes between (3,6) and (4,8). |
| |
Video 1: Real-time recording showing water slugs collecting at the back of the flow channel and coalescing with other slugs as some are pushed out of the channel. The start time corresponds to time 12193 sec. in the data file. Inlets are to the left. |
| |
File name: No File |
| |
|
Counter-current flows
| Carbon Cloth 1 |
Spatio-temporal data showing startup with low flows, (FO2, FH2) = (3,6), equilibration at (12,12), a decrease to (3,6) with irregular fluctuations, and a second increase to (12,12). |
| |
No video available |
| |
File name: MEA5-25-constcnt-flooding-cathodedown.xls |
| Carbon Cloth 2 |
Spatio-temporal data showing startup with low flows, (FO2, FH2) = (3,6), equilibration at (6,12), and a decrease to (3,6) with irregular fluctuations. |
| |
Video 1: Real-time recording showing a slug being removed with higher flow rates. The start time corresponds to time 9216 sec. in the data file. Oxygen inlet is to the right. |
| |
Video 2: Real-time recording showing slugs being slowly pushed along the back of the channel under low flow rates. The start time corresponds to time 73356 sec. in the data file. Oxygen inlet is to the to the right. |
| |
File name: MEA5-25-constcnt-flooding-cathodedown2.xls |
| |
|
| |
|
|
|
|
|
|
Horizontal, Cathode facing up |
|
|
|
|
Co-current flows
| Carbon Cloth 1 |
Spatio-temporal data showing startup with low flows, (FO2, FH2) = (3,6), then changes between (3,6) and (6,12) with fluctuations always observed. |
| |
No video available |
| |
File name: MEA5-25-constco-flooding-cathodeup.xls |
| Carbon Cloth 2 |
Spatio-temporal data showing startup with low flows, (FO2, FH2) = (3,6), equilibration at (6,12), and a decrease to (3,6), always with periodic fluctuations. |
| |
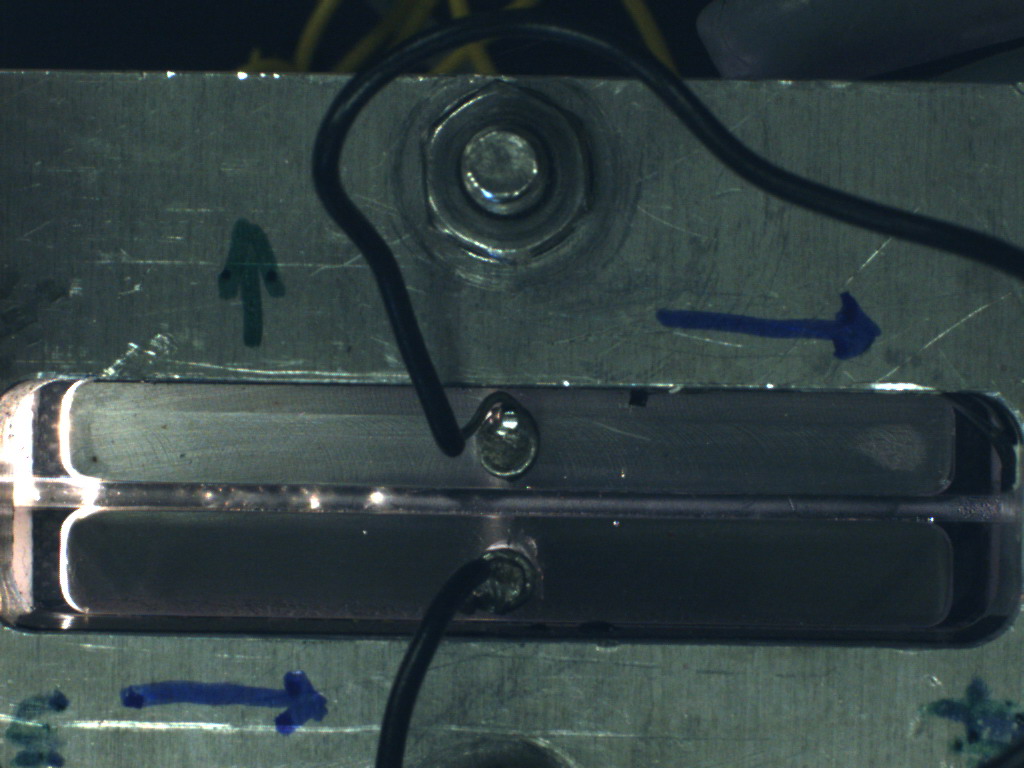
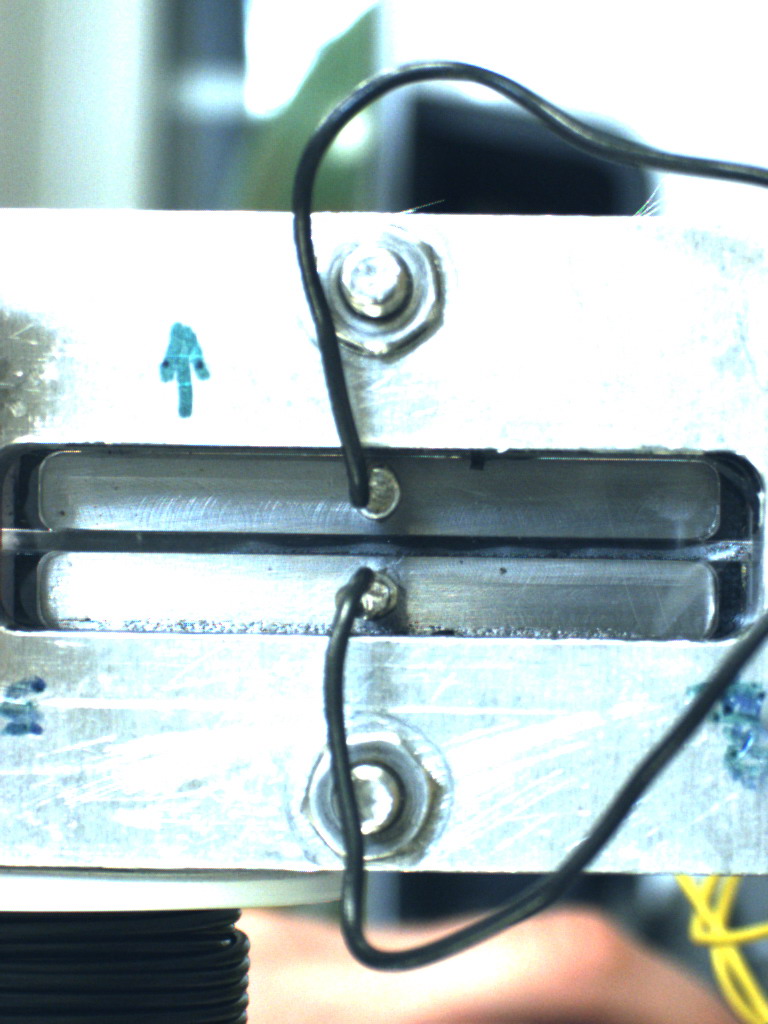
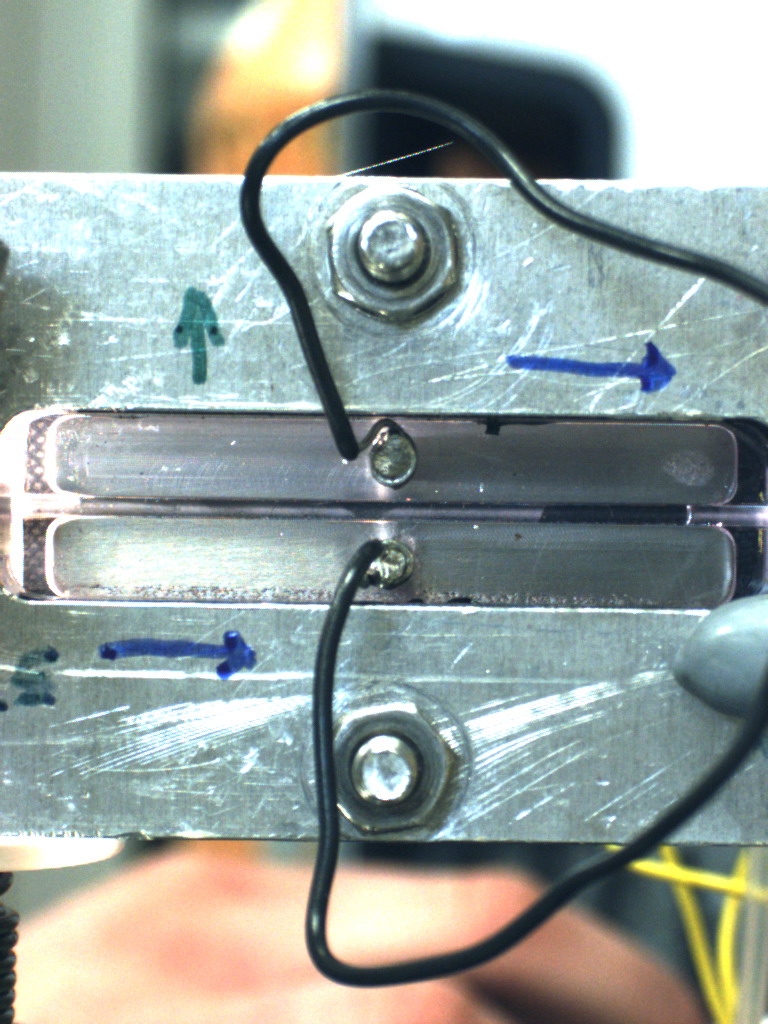
Image 1: Photo with side lighting showing water droplets sitting on top of the GDL. Taken at time 9144 sec., corresponding to the data file. Inlets to the left. |
| |
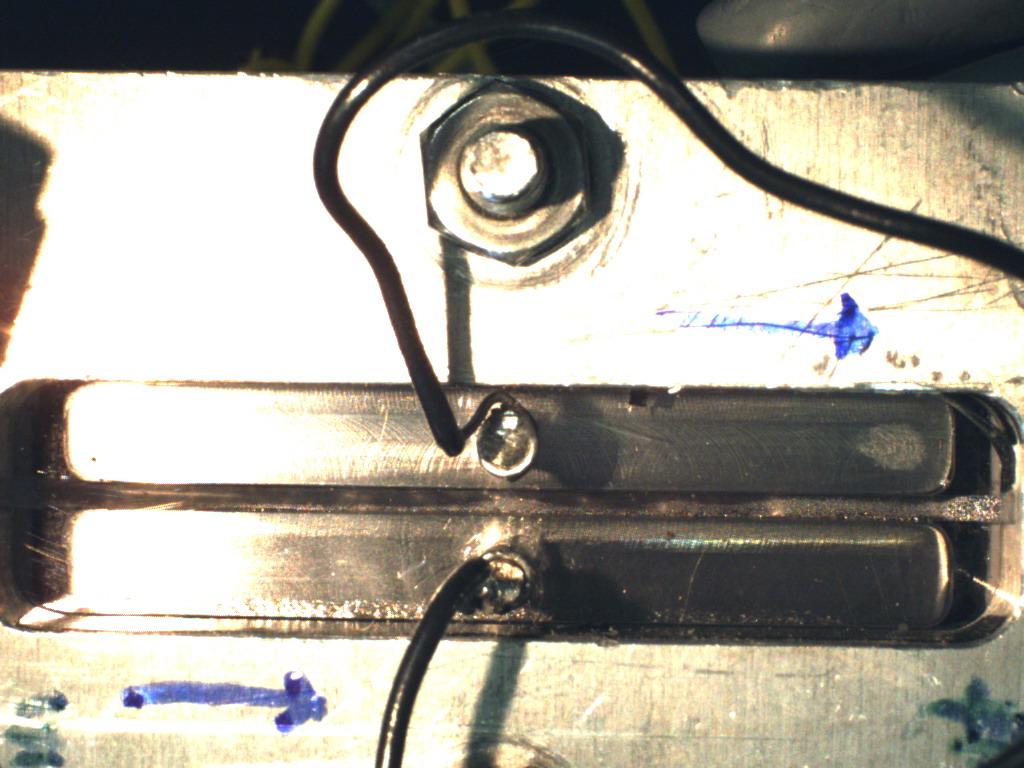
Image 2: Photo with front lighting showing condensation on the back of the flow channel. Taken at time 9080 sec., corresponding to the data file. Inlets to the left |
| |
File name: MEA5-25-constco-flooding-cathodeup3.xls |
| |
|
Counter-current flows
| Carbon Cloth 1 |
Spatio-temporal data showing startup with low flows, (FO2, FH2) = (6,6), an increase to (12,12), and a decrease down to (3,6). After the increase, a film of water forms on top of the GDL and the currents towards the outlets drop off dramatically. |
| |
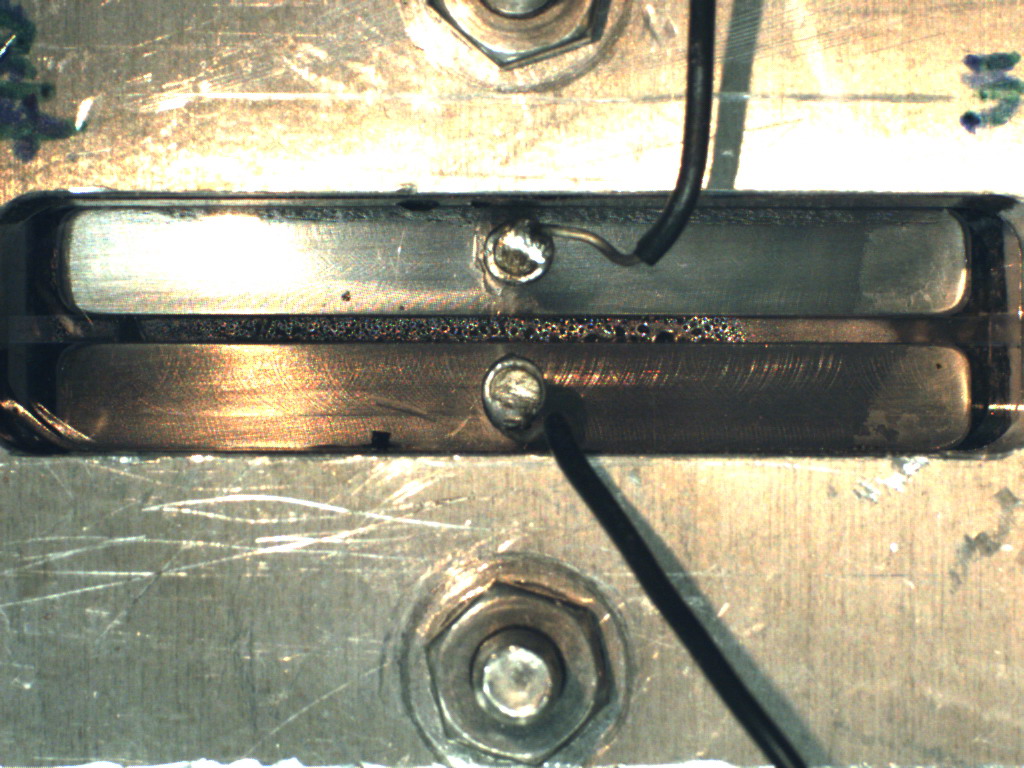
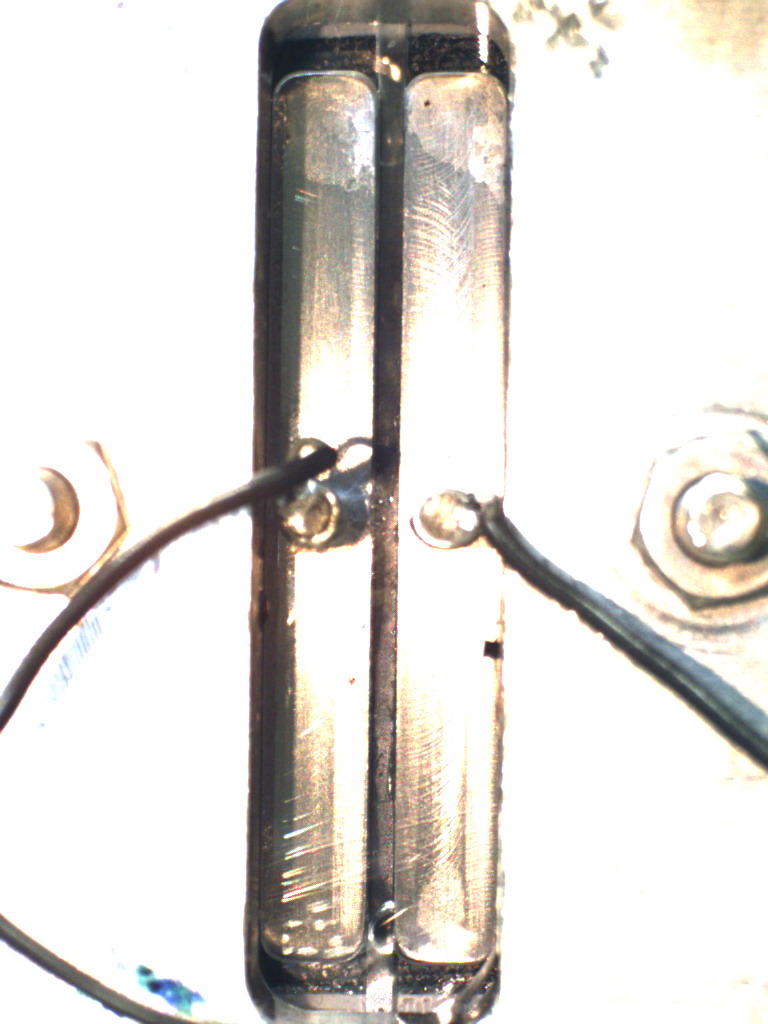
Image 1: Photo with front lighting showing condesation at the back of the flow channel and a larger build-up of water closer to the outlets. Taken at 22814 sec., corresponding to the data file. Oxygen inlet to the right. |
| |
File name: MEA5-25-constcnt-flooding-anodedown2.xls |
| |
|
| |
|
|
|
|
|
|
Horizontal, Cathode even with anode |
|
|
|
|
Co-current flows
| Carbon Cloth 1 |
Spatio-temporal data showing startup with low flows, (FO2, FH2) = (3,6), an increase to (12,12), and a decrease down to (3,6), where irregular fluctuations start. |
| |
Video 1: Frames taken at 1 per minute showing water forming slugs in the flow channel and periodically being pushed out. The start time corresponds to time 412 s in the data file. Inlets to the left. |
| |
Video 2: Real-time recording showing a slug forming near the inlets, being pushed along the channel, slowing as it nears the outlets, and coalescing with another slug. The start time corresponds to time 95273 sec. in the data file. Inlets to the left. |
| |
File name: MEA7-25-constco-flooding-horizontal2.xls |
| Carbon Cloth 2 |
Long-term spatio-temporal data showing equilibration at (FO2, FH2) = (3,6) and (6,12), and a decrease to (2.5,5). Fluctuations are observed with lower flows. |
| |
Image 1: Photo showing condensation on the back of the flow channel, mostly on the lower half. Taken at 170947 sec., corresponding to the data file. Inlets to the left. |
| |
File name: MEA5-25-constco-flooding-horizontal.xls |
| Carbon Cloth 3 |
Spatio-temporal data showing startup with low flows, (FO2, FH2) = (3,6), equilibration at (6,12), and a decrease down to (3,6.2), where irregular fluctuations start. The current from segment 1 was unusually low due to damage to the MEA. |
| |
Video 1: Frames taken at 1 per minute showing water collecting in the flow channel and periodically forming slugs that are then pushed out. The start time corresponds to time 151 sec. in the data file. Inlets to the left. |
| |
File name: MEA15-25-constco-flooding-horizontal1.xls |
| |
|
Counter-current flows
| Carbon Cloth 1 |
Spatio-temporal data showing a decrease from (FO2, FH2) = (6,12) to (3,6), resulting in irregular fluctuations (the cell was run at (6,12) for about 15 hours before the decrease). An increase back to (6,12) is also shown, resulting in stable currents. |
| |
Image 1: Photo showing a slug stuck in the channel near the outlets and condensation on the back of the channel. Taken at 17014 sec., corresponding to the data file. Inlets to the left. |
| |
File name: No File |
| |
|
| |
|
|
|
|
|
|
Vertical, Flows with gravity |
|
|
|
|
Co-current flows
| Carbon Cloth 1 |
Spatio-temporal data showing startup with low flows, (FO2, FH2) = (3,6), equilibration at (6,12), and a decrease down to (3,6), where irregular small fluctuations are observed. |
| |
Video 1: Real-time recording showing water collecting at the back of the flow channel and then forming a slug that is easily pushed out of the channel. The start time corresponds to time 78175 sec. in the data file. Inlets above the channel. |
| |
File name: MEA5-25-constco-flooding-inletsup.xls |
| Carbon Cloth 2 |
Spatio-temporal data showing startup with low flows, (FO2, FH2) = (3,6), equilibration at (6,12), and a decrease down to (3,6.2), where irregular small fluctuations are observed. |
| |
Video 1: Frames taken at 1 per minute showing water falling down the flow channel and periodically forming slugs that are then easily pushed out. The start time corresponds to time 246 sec. in the data file. Inlets above the channel. |
| |
File name: MEA15-25-constco-flooding-inletsup1.xls |
| |
|
Counter-current flows
| Carbon Cloth 1 |
Spatio-temporal data showing startup with low flows, (FO2, FH2) = (3,3), equilibration at (10,10), and a decrease down to (3,6), where irregular small fluctuations are observed. |
| |
Image 1: Photo showing increasing water build-up down the channel. Taken at 5482 sec., corresponding to the data file. Oxygen inlet above the channel. |
| |
File name: MEA5-25-constcnt-flooding-h2inletdown.xls |
| |
|
| |
|
|
|
|
|
|
Vertical, Flows against gravity |
|
|
|
|
Co-current flows
| Carbon Cloth 1 |
Spatio-temporal data showing startup with low flows, (FO2, FH2) = (3,6), equilibration at (6,12), and a decrease down to (3,6), where irregular small fluctuations are observed. |
| |
Video 1: Real-time recording showing a large amount of water built up in the flow channel with the gas flowing past. The start time corresponds to time 17543 sec. in the data file. Inlets are at the bottom. |
| |
Video 2: Real-time recording showing a large amount of water built up in the flow channel but only a very small amount of movement from the gas flowing by. The start time corresponds to time 21053 sec. in the data file. Inlets are at the bottom. |
| |
File name: MEA5-25-constco-flooding-inletsdown8.xls |
| Carbon Cloth 2 |
Spatio-temporal data showing startup with low flows, (FO2, FH2) = (3,6), equilibrations at (6,12), and a decrease to (2.9,6) where large periodic fluctuations are observed. A change to (2.9,12) is made and does not cause any change in the pattern of the fluctuations. |
| |
Video 1: Real-time recording showing a small amount of water built up near the top of the flow channel. A slug moves up the flow channel, slowing dramatically as it moves up, and coalesces with the water at the top. Some water is pushed out of the channel. The start time corresponds to time 10797 sec. in the data file. Inlets are at the bottom. |
| |
Video 2: Real-time recording showing a large amount of water built up near the top of the flow channel. A slug moves up the flow channel and coalesces with the water at the top. The large slug is slowly pushed out of the channel. The start time corresponds to time 18475 sec. in the data file. Inlets are at the bottom. |
| |
File name: No File |
| Carbon Cloth 3 |
Spatio-temporal data showing startup with low flows, (FO2, FH2) = (3,6), a long equilibration at (6,12), a decrease in flows to (3,6) with the currents remaining generally stable, and finally a change to (3,12) with dramatic fluctuations oberserved. |
| |
Video 1: Real-time recording showing stationary slugs at the top of the channel and near the middle. Small slugs form at the bottom of the channel and are only pushed about one third the way up the channel before they break apart and the water falls back down. Eventually enough water collects at the middle slug and it is pushed up the channel, causing a large fluctuation in the currents. The start time corresponds to time 84709 sec. in the data file. Inlets are at the bottom. |
| |
File name: MEA5-25-constco-flooding-inletsdown6.xls |
| Carbon Cloth 4 |
Spatio-temporal data showing a series of flow increases and decreases. After an increase from (FO2, FH2) = (3,6) to (4,8), the currents begin to fluctuate dramatically and then fall off dramatically. Large periodic fluctuations are oberserved before the currents become more stable and start to slowly recover. |
| |
Video 1: Real-time recording showing gas flowing by stationary slugs at multiple points in the the channel. The start time corresponds to time 17904 sec. in the data file. Inlets are at the bottom. |
| |
Video 2: Real-time recording showing the channel very flooded with water. Small slugs form at the bottom and are pushed only part way up before they break up and the water falls back down the channel. The start time corresponds to time 76687 sec. in the data file. Inlets are at the bottom. |
| |
File name: MEA5-25-constco-flooding-inletsdown2.xls |
| Carbon Cloth 5 |
Spatio-temporal data showing startup with lows flows, (FO2, FH2) = (3,6), and increase to (3.5,7), subsequent flow decreases, and finally flow increases. Fluctuations with different characteristics are oberserved at each step. |
| |
No video available. |
| |
File name: MEA5-25-constco-flooding-inletsdown11.xls |
| Carbon Cloth 6 |
Spatio-temporal data showing startup with low flows, (FO2, FH2) = (3,6), an increase to (6,12), a decrease to (3,12) with periodic oscillations observed, and a final decrease to (3,6) with continuing periodic oscillations after a large redistribution in the currents. |
| |
Video 1: Real-time recording showing slugs forming at the bottom of the channel and being pushed up to coalesce with a large stationary slug at the top. The slugs soon start to break up before being pushed out and water falls back down the channel. The start time corresponds to time 9513 sec. in the data file. Inlets are at the bottom. |
| |
File name: MEA5-25-constco-flooding-inletsdown5.xls |
| Carbon Cloth 7 |
Spatio-temporal data showing startup with low flows, (FO2, FH2) = (3,6), equilibration at (6,12), and then a series of flow changes that lead to irregular fluctuations and eventually to periodic oscillations. |
| |
Video 1: Frames taken at 1 per minute showing how water builds up in the flow channel with each of the different flow rates used in the experiment. The start time corresponds to time 248 sec. in the data file. Inlets are at the bottom. |
| |
Video 2: Real-time recording showing gas flowing past water at the bottom of the channel and slugs forming near the middle, being pushed up, and breaking up at the top. At 1:10, the cell was bumped, causing the lower slug to come loose. Slugs still form near the middle. The start time corresponds to time 106285 sec. in the data file. Inlets are at the bottom. |
| |
Video 3: Real-time recording showing slugs forming at the bottom of the channel, being pushed up, and breaking up near the top, corresponding to periodic oscillations in the currents. The start time corresponds to time 155599 sec. in the data file. Inlets are at the bottom. |
| |
File name: MEA7-25-constco-flooding-inletsdown2.xls |
| |
|
Counter-current flows
| Carbon Cloth 1 |
Spatio-temporal data showing startup and equilibration with flows (FO2, FH2) = (10,10), then a decrease to (3,6) with periodic fluctuations observed. An increase back to (10,10) stops the fluctuations. |
| |
Video 1: Real-time recording showing slugs forming at the bottom of the flow channel, being pushed up, and breaking up near the top of the channel. A large amount of water is oberserved in the channel. The start time corresponds to time 88631 sec. in the data file. The oxygen inlet is at the bottom. |
| |
File name: MEA5-25-constcnt-flooding-o2inletdown.xls |
| Carbon Cloth 2 |
Spatio-temporal data showing startup with low flows, (FO2, FH2) = (3,6), and equilibration at (6,12). Subsequent changes to (3,6), (3,12), and (2.5,5) are made that lead to irregular fluctuations. |
| |
Video 1: Real-time recording showing a large slug stuck at the top of the channel and a small slug stuck near the bottom. Little movement of the water is observed, but eventually the small slug would have moved to coalesce with the large slug, causing a fluctuation. The start time corresponds to time 88822 sec. in the data file. The oxygen inlet is at the bottom. |
| |
File name: MEA5-25-constcnt-flooding-o2inletdown2.xls |
| |
|
| |
|
| |
|
| |
|
|
|
|
|
|
|
Flow patterns
Co-current |
|
|
|
|
Horizontal, Cathode facing down
| Carbon Cloth 1 |
Spatio-temporal data showing startup with low flows, (FO2, FH2) = (3,6), an increase to (6,12) and a decrease to (3,6.2). Irregular fluctuations start after the decrease. |
| |
Video 1: Frames taken at 1 per minute showing water collecting at the back of the flow channel, periodically forming a slug, and being pushed out of the channel. The start time corresponds to time 546 s in the data file. Inlets are to the right. |
| |
File name: MEA15-25-constco-flooding-cathodedown1.xls |
| Carbon Cloth 2 |
Spatio-temporal data showing startup with low flows, (FO2, FH2) = (3,6), and changes between (3,6) and (4,8). |
| |
Video 1: Real-time recording showing water slugs collecting at the back of the flow channel and coalescing with other slugs as some are pushed out of the channel. The start time corresponds to time 12193 sec. in the data file. Inlets are to the left. |
| |
File name: No File |
| |
|
Horizontal, Cathode facing up
| Carbon Cloth 1 |
Spatio-temporal data showing startup with low flows, (FO2, FH2) = (3,6), then changes between (3,6) and (6,12) with fluctuations always observed. |
| |
No video available |
| |
File name: MEA5-25-constco-flooding-cathodeup.xls |
| Carbon Cloth 2 |
Spatio-temporal data showing startup with low flows, (FO2, FH2) = (3,6), equilibration at (6,12), and a decrease to (3,6), always with periodic fluctuations. |
| |
Image 1: Photo with side lighting showing water droplets sitting on top of the GDL. Taken at time 9144 sec., corresponding to the data file. Inlets to the left. |
| |
Image 2: Photo with front lighting showing condensation on the back of the flow channel. Taken at time 9080 sec., corresponding to the data file. Inlets to the left |
| |
File name: MEA5-25-constco-flooding-cathodeup3.xls |
| |
|
Horizontal, Cathode even with anode
| Carbon Cloth 1 |
Spatio-temporal data showing startup with low flows, (FO2, FH2) = (3,6), an increase to (12,12), and a decrease down to (3,6), where irregular fluctuations start. |
| |
Video 1: Frames taken at 1 per minute showing water forming slugs in the flow channel and periodically being pushed out. The start time corresponds to time 412 s in the data file. Inlets to the left. |
| |
Video 2: Real-time recording showing a slug forming near the inlets, being pushed along the channel, slowing as it nears the outlets, and coalescing with another slug. The start time corresponds to time 95273 sec. in the data file. Inlets to the left. |
| |
File name: MEA7-25-constco-flooding-horizontal2.xls |
| Carbon Cloth 2 |
Long-term spatio-temporal data showing equilibration at (FO2, FH2) = (3,6) and (6,12), and a decrease to (2.5,5). Fluctuations are observed with lower flows. |
| |
Image 1: Photo showing condensation on the back of the flow channel, mostly on the lower half. Taken at 170947 sec., corresponding to the data file. Inlets to the left. |
| |
File name: MEA5-25-constco-flooding-horizontal.xls |
| Carbon Cloth 3 |
Spatio-temporal data showing startup with low flows, (FO2, FH2) = (3,6), equilibration at (6,12), and a decrease down to (3,6.2), where irregular fluctuations start. The current from segment 1 was unusually low due to damage to the MEA. |
| |
Video 1: Frames taken at 1 per minute showing water collecting in the flow channel and periodically forming slugs that are then pushed out. The start time corresponds to time 151 sec. in the data file. Inlets to the left. |
| |
File name: MEA15-25-constco-flooding-horizontal1.xls |
| |
|
Vertical, Flows with gravity
| Carbon Cloth 1 |
Spatio-temporal data showing startup with low flows, (FO2, FH2) = (3,6), equilibration at (6,12), and a decrease down to (3,6), where irregular small fluctuations are observed. |
| |
Video 1: Real-time recording showing water collecting at the back of the flow channel and then forming a slug that is easily pushed out of the channel. The start time corresponds to time 78175 sec. in the data file. Inlets above the channel. |
| |
File name: MEA5-25-constco-flooding-inletsup.xls |
| Carbon Cloth 2 |
Spatio-temporal data showing startup with low flows, (FO2, FH2) = (3,6), equilibration at (6,12), and a decrease down to (3,6.2), where irregular small fluctuations are observed. |
| |
Video 1: Frames taken at 1 per minute showing water falling down the flow channel and periodically forming slugs that are then easily pushed out. The start time corresponds to time 246 sec. in the data file. Inlets above the channel. |
| |
File name: MEA15-25-constco-flooding-inletsup1.xls |
| |
|
Vertical, Flows against gravity
| Carbon Cloth 1 |
Spatio-temporal data showing startup with low flows, (FO2, FH2) = (3,6), equilibration at (6,12), and a decrease down to (3,6), where irregular small fluctuations are observed. |
| |
Video 1: Real-time recording showing a large amount of water built up in the flow channel with the gas flowing past. The start time corresponds to time 17543 sec. in the data file. Inlets are at the bottom. |
| |
Video 2: Real-time recording showing a large amount of water built up in the flow channel but only a very small amount of movement from the gas flowing by. The start time corresponds to time 21053 sec. in the data file. Inlets are at the bottom. |
| |
File name: MEA5-25-constco-flooding-inletsdown8.xls |
| Carbon Cloth 2 |
Spatio-temporal data showing startup with low flows, (FO2, FH2) = (3,6), equilibrations at (6,12), and a decrease to (2.9,6) where large periodic fluctuations are observed. A change to (2.9,12) is made and does not cause any change in the pattern of the fluctuations. |
| |
Video 1: Real-time recording showing a small amount of water built up near the top of the flow channel. A slug moves up the flow channel, slowing dramatically as it moves up, and coalesces with the water at the top. Some water is pushed out of the channel. The start time corresponds to time 10797 sec. in the data file. Inlets are at the bottom. |
| |
Video 2: Real-time recording showing a large amount of water built up near the top of the flow channel. A slug moves up the flow channel and coalesces with the water at the top. The large slug is slowly pushed out of the channel. The start time corresponds to time 18475 sec. in the data file. Inlets are at the bottom. |
| |
File name: No File |
| Carbon Cloth 3 |
Spatio-temporal data showing startup with low flows, (FO2, FH2) = (3,6), a long equilibration at (6,12), a decrease in flows to (3,6) with the currents remaining generally stable, and finally a change to (3,12) with dramatic fluctuations oberserved. |
| |
Video 1: Real-time recording showing stationary slugs at the top of the channel and near the middle. Small slugs form at the bottom of the channel and are only pushed about one third the way up the channel before they break apart and the water falls back down. Eventually enough water collects at the middle slug and it is pushed up the channel, causing a large fluctuation in the currents. The start time corresponds to time 84709 sec. in the data file. Inlets are at the bottom. |
| |
File name: MEA5-25-constco-flooding-inletsdown6.xls |
| Carbon Cloth 4 |
Spatio-temporal data showing a series of flow increases and decreases. After an increase from (FO2, FH2) = (3,6) to (4,8), the currents begin to fluctuate dramatically and then fall off dramatically. Large periodic fluctuations are oberserved before the currents become more stable and start to slowly recover. |
| |
Video 1: Real-time recording showing gas flowing by stationary slugs at multiple points in the the channel. The start time corresponds to time 17904 sec. in the data file. Inlets are at the bottom. |
| |
Video 2: Real-time recording showing the channel very flooded with water. Small slugs form at the bottom and are pushed only part way up before they break up and the water falls back down the channel. The start time corresponds to time 76687 sec. in the data file. Inlets are at the bottom. |
| |
File name: MEA5-25-constco-flooding-inletsdown2.xls |
| Carbon Cloth 5 |
Spatio-temporal data showing startup with lows flows, (FO2, FH2) = (3,6), and increase to (3.5,7), subsequent flow decreases, and finally flow increases. Fluctuations with different characteristics are oberserved at each step. |
| |
No video available. |
| |
File name: MEA5-25-constco-flooding-inletsdown11.xls |
| Carbon Cloth 6 |
Spatio-temporal data showing startup with low flows, (FO2, FH2) = (3,6), an increase to (6,12), a decrease to (3,12) with periodic oscillations observed, and a final decrease to (3,6) with continuing periodic oscillations after a large redistribution in the currents. |
| |
Video 1: Real-time recording showing slugs forming at the bottom of the channel and being pushed up to coalesce with a large stationary slug at the top. The slugs soon start to break up before being pushed out and water falls back down the channel. The start time corresponds to time 9513 sec. in the data file. Inlets are at the bottom. |
| |
File name: MEA5-25-constco-flooding-inletsdown5.xls |
| Carbon Cloth 7 |
Spatio-temporal data showing startup with low flows, (FO2, FH2) = (3,6), equilibration at (6,12), and then a series of flow changes that lead to irregular fluctuations and eventually to periodic oscillations. |
| |
Video 1: Frames taken at 1 per minute showing how water builds up in the flow channel with each of the different flow rates used in the experiment. The start time corresponds to time 248 sec. in the data file. Inlets are at the bottom. |
| |
Video 2: Real-time recording showing gas flowing past water at the bottom of the channel and slugs forming near the middle, being pushed up, and breaking up at the top. At 1:10, the cell was bumped, causing the lower slug to come loose. Slugs still form near the middle. The start time corresponds to time 106285 sec. in the data file. Inlets are at the bottom. |
| |
Video 3: Real-time recording showing slugs forming at the bottom of the channel, being pushed up, and breaking up near the top, corresponding to periodic oscillations in the currents. The start time corresponds to time 155599 sec. in the data file. Inlets are at the bottom. |
| |
File name: MEA7-25-constco-flooding-inletsdown2.xls |
| |
|
| |
|
|
|
|
|
|
Counter-current |
|
|
|
|
Horizontal, Cathode facing down
| Carbon Cloth 1 |
Spatio-temporal data showing startup with low flows, (FO2, FH2) = (3,6), equilibration at (12,12), a decrease to (3,6) with irregular fluctuations, and a second increase to (12,12). |
| |
No video available |
| |
File name: MEA5-25-constcnt-flooding-cathodedown.xls |
| Carbon Cloth 2 |
Spatio-temporal data showing startup with low flows, (FO2, FH2) = (3,6), equilibration at (6,12), and a decrease to (3,6) with irregular fluctuations. |
| |
Video 1: Real-time recording showing a slug being removed with higher flow rates. The start time corresponds to time 9216 sec. in the data file. Oxygen inlet is to the right. |
| |
Video 2: Real-time recording showing slugs being slowly pushed along the back of the channel under low flow rates. The start time corresponds to time 73356 sec. in the data file. Oxygen inlet is to the to the right. |
| |
File name: MEA5-25-constcnt-flooding-cathodedown2.xls |
| |
|
Horizontal, Cathode facing up
| Carbon Cloth 1 |
Spatio-temporal data showing startup with low flows, (FO2, FH2) = (6,6), an increase to (12,12), and a decrease down to (3,6). After the increase, a film of water forms on top of the GDL and the currents towards the outlets drop off dramatically. |
| |
Image 1: Photo with front lighting showing condesation at the back of the flow channel and a larger build-up of water closer to the outlets. Taken at 22814 sec., corresponding to the data file. Oxygen inlet to the right. |
| |
File name: MEA5-25-constcnt-flooding-anodedown2.xls |
| |
|
Horizontal, Cathode even with anode
| Carbon Cloth 1 |
Spatio-temporal data showing a decrease from (FO2, FH2) = (6,12) to (3,6), resulting in irregular fluctuations (the cell was run at (6,12) for about 15 hours before the decrease). An increase back to (6,12) is also shown, resulting in stable currents. |
| |
Image 1: Photo showing a slug stuck in the channel near the outlets and condensation on the back of the channel. Taken at 17014 sec., corresponding to the data file. Inlets to the left. |
| |
File name: MEA5-25-constcnt-flooding-horizontal2-cont.xls |
| |
|
Vertical, Flows with gravity
| Carbon Cloth 1 |
Spatio-temporal data showing startup with low flows, (FO2, FH2) = (3,3), equilibration at (10,10), and a decrease down to (3,6), where irregular small fluctuations are observed. |
| |
Image 1: Photo showing increasing water build-up down the channel. Taken at 5482 sec., corresponding to the data file. Oxygen inlet above the channel. |
| |
File name: MEA5-25-constcnt-flooding-h2inletdown.xls |
| |
|
Vertical, Flows against gravity
| Carbon Cloth 1 |
Spatio-temporal data showing startup and equilibration with flows (FO2, FH2) = (10,10), then a decrease to (3,6) with periodic fluctuations observed. An increase back to (10,10) stops the fluctuations. |
| |
Video 1: Real-time recording showing slugs forming at the bottom of the flow channel, being pushed up, and breaking up near the top of the channel. A large amount of water is oberserved in the channel. The start time corresponds to time 88631 sec. in the data file. The oxygen inlet is at the bottom. |
| |
File name: MEA5-25-constcnt-flooding-o2inletdown.xls |
| Carbon Cloth 2 |
Spatio-temporal data showing startup with low flows, (FO2, FH2) = (3,6), and equilibration at (6,12). Subsequent changes to (3,6), (3,12), and (2.5,5) are made that lead to irregular fluctuations. |
| |
Video 1: Real-time recording showing a large slug stuck at the top of the channel and a small slug stuck near the bottom. Little movement of the water is observed, but eventually the small slug would have moved to coalesce with the large slug, causing a fluctuation. The start time corresponds to time 88822 sec. in the data file. The oxygen inlet is at the bottom. |
| |
File name: MEA5-25-constcnt-flooding-o2inletdown2.xls |
|
|
Nafion |
|
| Water 1 |
A 10 μL drop of water is placed on a dry piece of Nafion constrained in an aluminum frame. Nafion has a thickness of 0.005" and a diameter of 24 mm. |
| |
Video 1:
0:39 in length; video taken at 15 frames per second. Scale included. |
| |
Video 2: 1:10 in length;
frames are taken every 59 seconds. Scale included. |
| Methanol 1 |
A 10 μL drop of methanol is placed on a dry piece of Nafion constrained in an aluminum frame. Nafion has a thickness of 0.005" and a diameter of 24 mm. |
| |
Video 1:
1:04 in length; up to 0:30 is the beginning when the drop is placed upon the membrane, the last half is when the drop is at its final stages of evaporation. Video taken at 15 frames per second. Scale included. |
| |
Video 2: 0:05 in length;
frames are taken every 59 seconds. Scale included. |
| Methanol 2 |
A 10 μL drop of methanol is placed on a dry piece of Nafion constrained in an aluminum frame. Nafion has a thickness of 0.005" and a diameter of 24 mm. |
| |
Video 1:
1:29 in length; frames taken every 9 seconds. Scale included. |
| Methanol 3 |
A 10 μL drop of methanol is placed on a dry piece of Nafion constrained in an aluminum frame. Nafion has a thickness of 0.005" and a diameter of 24 mm. |
| |
Video 1:
1:32 in length; frames taken every 9 seconds. Scale included. |
| Methanol 4 |
A 10 μL drop of methanol is placed on a wet piece of Nafion constrained in an aluminum frame. Nafion was equilibrated at 100% RH, has a thickness of 0.005", and has a diameter of 24 mm. |
| |
Video 1:
1:16 in length; frames taken every 59 seconds. Scale included. |
| Methanol 5 |
A 10 μL drop of methanol is placed on a dry piece of Nafion constrained in an aluminum frame. Nafion has a thickness of 0.002" and a diameter of 24 mm. |
| |
Video 1:
0:36 in length; frames taken every 9 seconds. Scale included. |
| Octane 1 |
A 10 μL drop of octane is placed on a dry piece of Nafion constrained in an aluminum frame. Nafion has a thickness of 0.005" and a diameter of 24 mm. |
| |
Video 1:
0:38 in length; video taken at 15 frames per second. Scale included. |
| |
Video 2: 0:37 in length;
frames are taken every 59 seconds. Scale included. |
| |
|
Teflon |
|
| Methanol 1 |
A 10 μL drop of methanol is placed on a dry piece of Teflon constrained in an aluminum frame. The Teflon has a thickness of 0.005" and a diameter of 24 mm. |
| |
Video 1:
0:30 in length; video taken at 15 frames per second. Scale included. |
| |
Video 2: 0:15 in length;
frames are taken every 59 seconds. Scale included. |
| Methanol 2 |
A 10 μL drop of methanol is placed on a dry piece of Teflon constrained in an aluminum frame. The Teflon has a thickness of 0.005" and a diameter of 24 mm. |
| |
Video 1:
1:31 in length;
frames are taken every 9 seconds. Scale included. |
| |
|
|
Liquids
|
|
Water |
|
| Nafion 1 |
A 10 μL drop of water is placed on a dry piece of Nafion constrained in an aluminum frame. Nafion has a thickness of 0.005" and a diameter of 24 mm. |
| |
Video 1:
0:39 in length; video taken at 15 frames per second. Scale included. |
| |
Video 2: 1:10 in length;
frames are taken every 59 seconds. Scale included. |
| |
|
|
Methanol |
|
| Nafion 1 |
A 10 μL drop of methanol is placed on a dry piece of Nafion constrained in an aluminum frame. Nafion has a thickness of 0.005" and a diameter of 24 mm. |
| |
Video 1:
1:04 in length; up to 0:30 is the beginning when the drop is placed upon the membrane, the last half is when the drop is at its final stages of evaporation. Video taken at 15 frames per second. Scale included. |
| |
Video 2: 0:05 in length;
frames are taken every 59 seconds. Scale included. |
| Nafion 2 |
A 10 μL drop of methanol is placed on a dry piece of Nafion constrained in an aluminum frame. Nafion has a thickness of 0.005" and a diameter of 24 mm. |
| |
Video 1:
1:29 in length; frames taken every 9 seconds. Scale included. |
| Nafion 3 |
A 10 μL drop of methanol is placed on a dry piece of Nafion constrained in an aluminum frame. Nafion has a thickness of 0.005" and a diameter of 24 mm. |
| |
Video 1:
1:32 in length; frames taken every 9 seconds. Scale included. |
| Nafion 4 |
A 10 μL drop of methanol is placed on a wet piece of Nafion constrained in an aluminum frame. Nafion was equilibrated at 100% RH, has a thickness of 0.005", and has a diameter of 24 mm. |
| |
Video 1:
1:16 in length; frames taken every 59 seconds. Scale included. |
| Nafion 5 |
A 10 μL drop of methanol is placed on a dry piece of Nafion constrained in an aluminum frame. Nafion has a thickness of 0.002" and a diameter of 24 mm. |
| |
Video 1:
0:36 in length; frames taken every 9 seconds. Scale included. |
| Teflon 1 |
A 10 μL drop of methanol is placed on a dry piece of Teflon constrained in an aluminum frame. The Teflon has a thickness of 0.005" and a diameter of 24 mm. |
| |
Video 1:
0:30 in length; video taken at 15 frames per second. Scale included. |
| |
Video 2: 0:15 in length;
frames are taken every 59 seconds. Scale included. |
| Teflon 2 |
A 10 μL drop of methanol is placed on a dry piece of Teflon constrained in an aluminum frame. The Teflon has a thickness of 0.005" and a diameter of 24 mm. |
| |
Video 1:
1:31 in length;
frames are taken every 9 seconds. Scale included. |
| |
|
|
Octane |
|
| Nafion 1 |
A 10 μL drop of octane is placed on a dry piece of Nafion constrained in an aluminum frame. Nafion has a thickness of 0.005" and a diameter of 24 mm. |
| |
Video 1:
0:38 in length; video taken at 15 frames per second. Scale included. |
| |
Video 2: 0:37 in length;
frames are taken every 59 seconds. Scale included. |
| |
|
|
